Culture change can feel slippery. People sense it in meetings, in the tone of a Slack thread, in whether mistakes are treated as learning or as blame. Yet leaders still need numbers and evidence, because culture is also a business asset. Without measurement, strengths-based work risks becoming a one-off workshop that people enjoyed, then quietly forgot.
A strengths-based organisation is not one where everyone is relentlessly positive. It is one where talent is named, valued, and applied to real outcomes, with leaders and teams using a shared language to allocate work, solve problems, develop people, and make decisions. That sort of shift is measurable, especially if you look for leading indicators that show whether daily behaviour is changing.
Why leading indicators matter
Lagging indicators are the results you see once culture has already shifted: retention, productivity, customer satisfaction, quality, profitability. They matter, but they arrive late and they are influenced by many variables outside culture.
Leading indicators are earlier signals that the habits are taking root. They help leaders steer while the change is still in motion, not once it is over.
A strengths-based approach benefits from this distinction because it is designed to move from insight to application. The CliftonStrengths assessment can create a surge of awareness in days. The real culture change is whether people keep using strengths language and strengths habits months later, especially under pressure.
What exactly are you measuring?
Before deciding on metrics, it helps to be clear about the “unit” of culture you want to shift. In strengths-based work, there are usually five practical layers that can be observed.
Start by writing a one-page “culture hypothesis” that links strengths practices to outcomes you care about, with a few behavioural examples. Then measure whether those behaviours are becoming normal.
A useful way to frame it is:
- Strengths awareness (Do we know our talents?)
- Strengths application (Do we use them in work and collaboration?)
- Strengths support (Do leaders and systems make it easy?)
- Strengths conversations (Do we talk about strengths in the flow of work?)
- Strengths outcomes (Do we see movement in engagement, wellbeing, performance?)
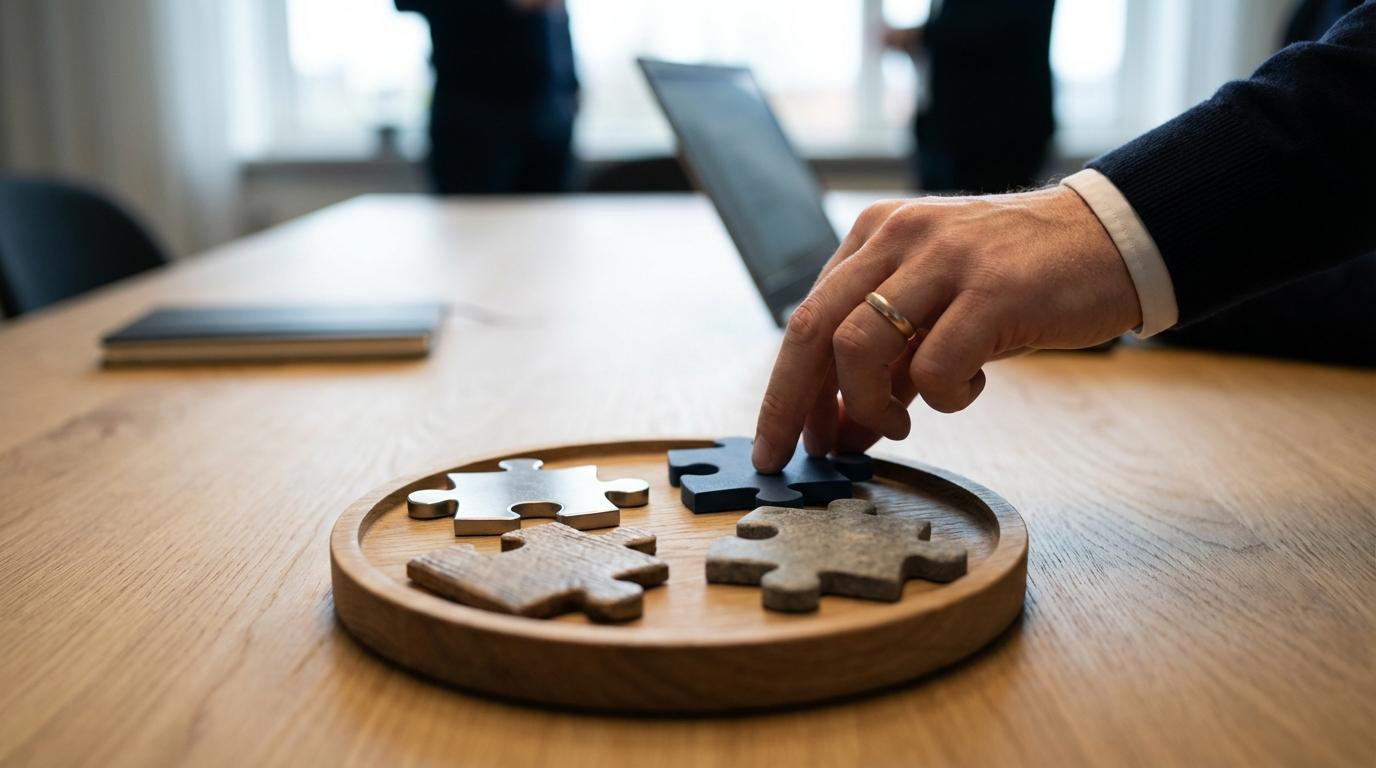
A strengths-based measurement model, from everyday behaviour to business results
A strong measurement system mixes quantitative and qualitative signals. Numbers tell you direction and scale. Stories tell you mechanism: what is actually changing and why.
If you want one simple picture, think of it as three stacks of evidence:
- Adoption: Are people taking part and completing the basics?
- Behaviour: Are routines changing in teams and leadership?
- Impact: Are engagement and performance shifting over time?
That structure fits well with organisations using CliftonStrengths, Gallup Q12, coaching, and a digital platform to sustain habits. It also avoids the trap of equating “attendance” with “culture”.
Leading indicators that signal strengths are becoming “how we do things”
Leading indicators should be easy to collect, hard to game, and closely tied to daily work. They should also be clear enough that a manager can act on them within a fortnight.
The list below is intentionally practical, because culture change is practical.
- Participation rate in strengths rollout
- Manager completion of strengths leadership training
- Frequency of strengths check-ins in 1:1s
- Team strengths mapping completed and revisited
- Internal communications using strengths language
- Peer recognition that names specific contributions
- Pulse responses on “I get to do what I do best”
- Evidence of job crafting and role shaping
Those are not all equal. Participation is an early spark; behaviour and language are better indicators of culture.
The strongest “early proof” is in routines
The shift becomes real when strengths show up in the moments that matter: prioritisation, delegation, feedback, hiring, onboarding, project kick-offs, and retrospectives.
A short audit question helps: “Where would I expect to see strengths if this were working?” Then go and look.
A simple dashboard you can actually run
The table below is a practical starting point. Most organisations can implement it with an annual engagement survey, a quarterly pulse, a light qualitative rhythm, and data from learning or habit platforms.
| Area | Leading indicator | What it shows | How to measure | Cadence | What to do if it dips |
|---|---|---|---|---|---|
| Capability | % of people with CliftonStrengths profile shared with team | Strengths are visible, not private | Team record or workshop completion | Monthly during rollout | Ask leaders to model sharing first |
| Leadership | “My manager helps me use my strengths” (pulse item) | Support for application | 1 to 2 pulse questions | Quarterly | Coach managers on strengths-based 1:1s |
| Team habits | Strengths used in planning and retrospectives | Strengths are operational | Checklists or team self-report | Monthly | Provide a simple meeting script |
| Language | Strengths referenced in recognition messages | Strengths are socially reinforced | Sample internal posts, tagging, themes | Quarterly | Run a strengths-spotting campaign |
| Systems | Strengths included in performance and development templates | HR processes reinforce the culture | Template audit and uptake | Biannually | Update forms, train reviewers |
| Engagement | Gallup Q12 movement in targeted items | Energy, clarity, support | Annual Q12, team cuts | Annually | Focus on local action planning |
| Sustainability | Habit streaks or completions in a learning platform | Behaviours are repeated | Platform analytics, reflections | Monthly | Add micro-practices and prompts |
This type of dashboard works well when leaders agree in advance what “good” looks like. A target is not a punishment; it is a shared definition of progress.
Using engagement data without reducing culture to a score
Engagement is a powerful outcome measure for strengths-based work because strengths application is strongly linked to engagement in Gallup’s research. It is also easy to misuse.
One safeguard is to treat engagement scores as a compass, then combine them with behavioural evidence. If engagement rises while strengths habits are absent, something else may be driving the change. If strengths habits are strong while engagement is flat, the organisation may be in a difficult business period, or managers may need support turning strengths into clarity and priorities.
A practical pairing many organisations use is:
- CliftonStrengths for capability and language
- Q12 for engagement and managerial impact
- A small set of pulse items for momentum
- Qualitative interviews for meaning and mechanism
Qualitative indicators: the stories that predict the numbers
Culture changes in language before it changes in systems. That makes qualitative data a genuine leading indicator, not a “nice to have”.
A simple rhythm works:
- Short interviews across levels every quarter
- Focus groups after key milestones
- Observation of a sample of meetings
- Light review of internal communication themes
Then track the direction of the narratives. You are listening for shifts like: people naming strengths without prompting; teams talking about contribution rather than personality; managers giving feedback through a strengths lens; people requesting roles that fit their talents.
To keep it disciplined, use a consistent set of prompts and code the responses into themes. Over time, you get trend data that still respects the nuance of lived experience.
Measuring “strengths use” and “support for strengths use”
If you want more precision than a few pulse questions, validated scales exist, including strengths-use measures and measures of perceived organisational support for strengths use. They can sit alongside your engagement survey, or be used as a targeted diagnostic in selected units.
These instruments are valuable because they separate two things that are often muddled:
- Do I use my strengths?
- Does the organisation make it easy for me to use them?
That distinction matters. A motivated employee can push through barriers for a while. A strengths-based culture removes the barriers.
Short-term signals vs long-term proof
Leaders often expect culture change to “show up in the numbers” quickly. A strengths-based shift does produce early momentum, yet the long-term proof depends on sustained practice.
Here is a useful time horizon:
- 0 to 3 months: participation, shared language, early manager behaviour
- 3 to 9 months: team routines, role shaping, improvement in local engagement items
- 9 to 18 months: clearer movement in engagement trends, retention signals, productivity and quality indicators stabilising upward
If you measure only at month 18, you lose the chance to course-correct. If you measure only in month 2, you confuse enthusiasm with embedding.
Three pitfalls that make culture measurement unreliable
It is easy to create a measurement system that looks busy while telling you very little.
Common traps include:
- Vanity metrics: counting workshop attendance and calling it “adoption”.
- Data without decisions: collecting pulses with no visible follow-up.
- Overly complex models: so many indicators that nobody owns them.
A strong system has clear ownership. It also creates trust, because employees see that data leads to action, not to blame.
Turning indicators into action: an operating rhythm leaders can keep
Measurement should create better conversations, not more reporting. A light cadence works best, supported by a few repeatable moments.
A practical operating rhythm might include:
- Monthly: team lead checks one strengths habit and one friction point.
- Quarterly: leaders review a small dashboard and choose one behavioural focus.
- Annually: run a full engagement survey, share results, agree local actions.
If you use a digital platform to sustain habits, keep the focus on application. The metric that matters is not “content consumed”, it is whether people are practising strengths in real work, and reflecting on the impact.
What a strengths-based organisation looks like when the indicators are moving
When leading indicators are healthy, you can often feel it in the pace and quality of work. Meetings become sharper because roles are clearer. Feedback becomes more specific because people can name contributions. Collaboration improves because difference is interpreted as useful, not inconvenient.
Culture change is measurable, and it is also human. The most encouraging sign is when strengths language stops sounding like a programme and starts sounding like everyday work: quiet, specific, and normal.


Læg en kommentar